In this tutorial, I am going to discuss what is java heap dump and what are the different ways to capture a java heap dumps.
What is a Heap Dump?
A heap dump is the snapshot of all the objects in the JVM at a certain moment. In simple words, It is the snapshot of the java memory.
The heap dump is useful in debugging java memory-leak issue and out-of-memory error in java applications. Heap dump is capture/store in binary format (hprof) files.
Once heap dump is taken it can be analyzed through heap analyzer tools such as Eclipse memory analyzer tool (MAT), JVisualVM, HeapHero etc. In this tutorial, i am only going to discuss how to generate java heap dumps.
Different Ways to Capture Java Heap Dumps
Let’s talk about the various ways through which we can take java heap dump.
Heap Dump on Application Out of Memory
The purpose of taking a heap dump is to troubleshoot out of memory error by analyzing what all live objects are occupying the memory and by what percentage.
It’s ideal to capture heap dump when an application experiences java.lang.OutOfMemoryError. We can do this by setting a JVM flag, the heap dump will be captured automatically whenever the application throws java.lang.OutOfMemoryError.
|
1 |
-XX:+HeapDumpOnOutOfMemoryError |
Also, We can specify at which location this heap dump will be created.
|
1 |
-XX:HeapDumpPath=/tmp/heapdump.hprof |
jmap
The jmap command-line utility prints memory-related statistics for a running java process. To generate a heap dump using jmap, we need to use this command.
|
1 |
jmap -dump:[live],format=b,file=<file-path> <pid> |
Let’s discuss these options.
- live: If live option is passed, then it only capture objects which have active references. This parameter is optional. By setting the dump option live, it will trigger full gc before creating heap dump.
- format=b: It’s for setting binary format. If not set, the result is the same.
- file: The heap dump file name
- pid: It is the java process id.
|
1 |
jmap -dump:live,format=b,file=/tmp/heapdump.hprof 16987 |
The jmap command will trigger a full GC when the live option is used. If you want to take a heap dump without triggering full GC then don’t pass live option in dump command.
|
1 |
jmap -dump:format=b,file=/tmp/heapdump.hprof 16987 |
jcmd
The jcmd command is a very useful JDK utility, it works by sending command requests to the JVM. To take the heap dump through jcmd pass GC.heap_dump with process id and file path.
|
1 |
jcmd <pid> GC.heap_dump <file-path> |
Like jmap, it also generates the heap dump in a binary format.
|
1 |
jcmd 57611 GC.heap_dump /tmp/heapdump.hprof |
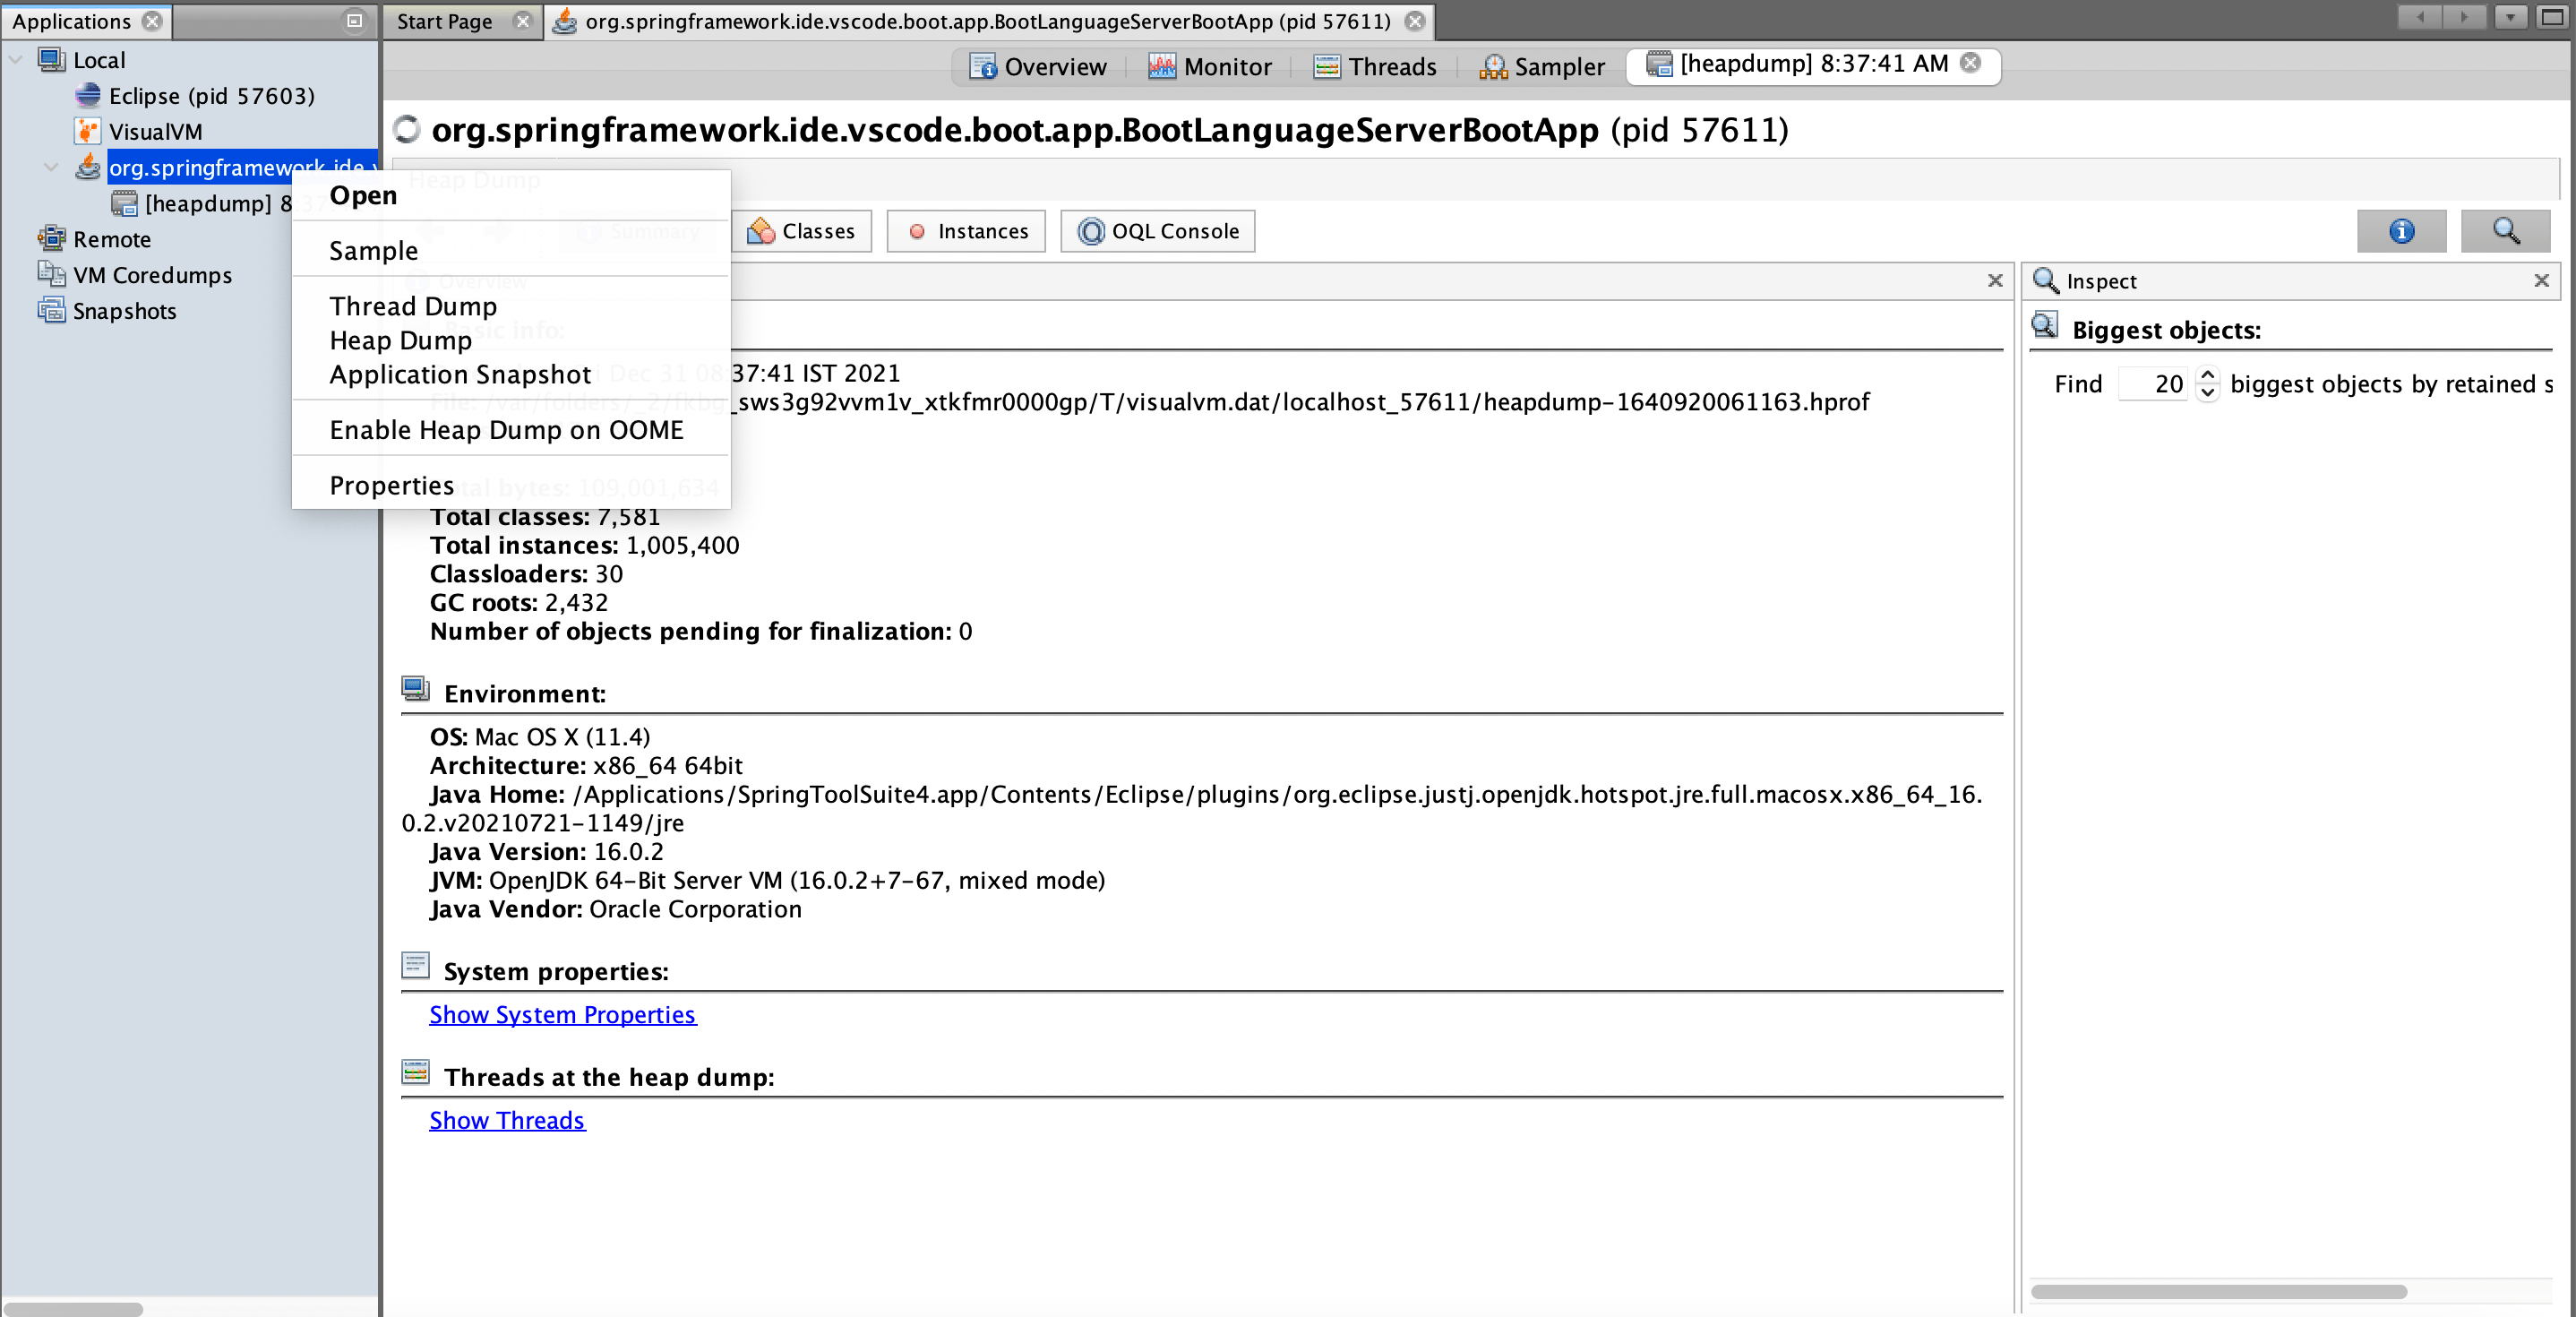
JVisualVM
Java VisualVM is a graphical user interface tool which let’s us monitor, troubleshoot, and profile Java applications. Like jmap and jcmd, it also shipped through jdk.
To take the heap dump through JVisualVM, open the JVisualVM you can see all the running java processes. Right-click on a Java process and select the “Heap Dump” option, JVisualVM will create a heap dump and open it in a new tab